
Stop Losing Profit You Don’t Know You’re Losing – Case Study
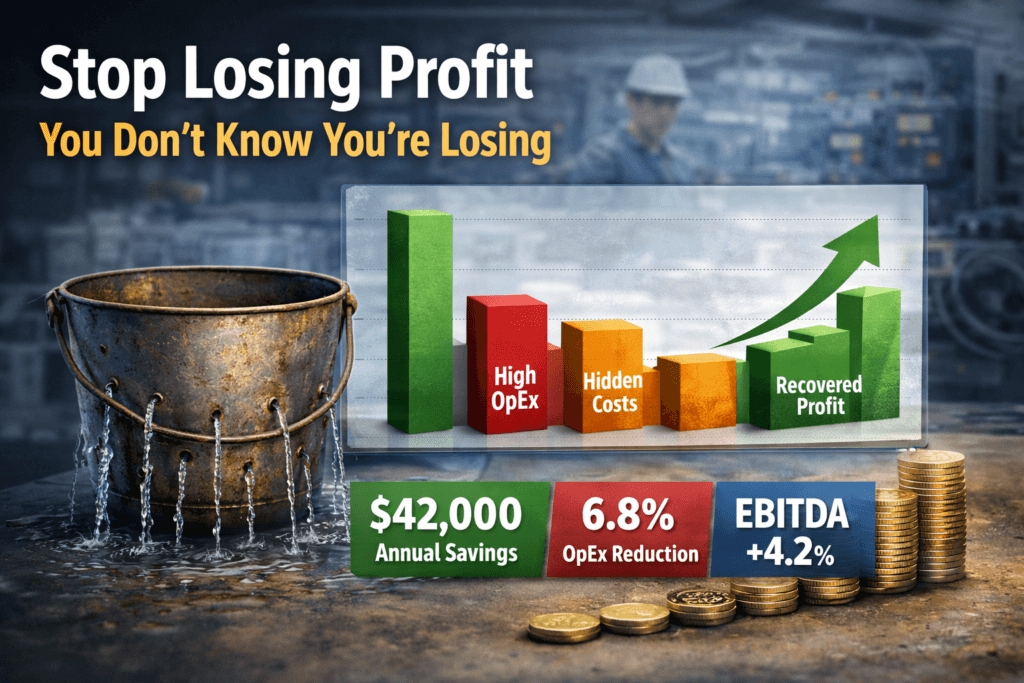
A Manufacturing Company Recovered $42,000 Annually—Without Increasing Sales
If your revenue is growing but cash flow isn’t improving, the problem isn’t growth.
It’s financial leakage.
The Situation
A mid-sized manufacturing company ($8M–$15M revenue) was performing well on paper:
- Strong and consistent sales growth
- Stable production output
- Increasing demand
Yet:
- Cash flow remained tight
- Margins were under pressure
- Financing dependency was increasing
Initial assumption: rising material and labor costs
Actual issue: hidden operating expense inefficiencies
The Problem: Strong Sales, Weak Cash Flow
A mid-sized manufacturing company was growing revenue consistently—but cash flow remained tight.
- Margins were stagnant
- Financing needs were increasing
- No clear visibility into cost drivers
Management assumption: rising material and labor costs were the issue
Reality: uncontrolled operating expenses were quietly eroding profit
What We Found: The “Leaky Bucket”
A structured financial analysis revealed that money wasn’t being lost in large, obvious ways—it was leaking slowly across multiple areas:
- $2,000/month in unused or redundant software subscriptions
- Vendor contracts priced on outdated terms
- Excess banking and payment processing fees
Monthly Leakage Identified
$3,200 – $4,000
Where the Money Was Going (Before vs After)
Before Optimization (Monthly OpEx Snapshot):
- Software & Tools: inflated due to redundancy
- Vendor Costs: unoptimized pricing
- Banking Fees: above market rates
After Optimization:
- Consolidated software stack
- Renegotiated vendor agreements
- Reduced financial service costs
Operating Expense Trend (Before vs After)
Month Before ($) After ($)
Jan 285,000 266,000
Feb 288,500 267,200
Mar 290,000 268,000
Apr 289,200 267,500
May 291,000 268,300
Jun 292,500 269,000
What this shows:
- Revenue remained constant
- Cost base structurally reduced
- Savings are recurring—not one-time
Financial Impact
Key Metrics
- Operating Expense Reduction: 6.8%
- Annual Cost Savings: ~$42,000
- EBITDA Increase: +4.2%
- Cash Flow Improvement: Immediate
- Payback Period: < 30 days
Profit Bridge (Waterfall View)
Revenue → Operating Costs → Hidden Leakage → Recovered Profit
- Revenue remained unchanged
- Costs reduced through targeted actions
- Leakage converted directly into profit
This is pure margin expansion—not growth-dependent
Industry Benchmark Comparison
| Metric | Before | After | Industry Benchmark |
|---|---|---|---|
| OpEx % of Revenue | 28.5% | 26.6% | 25–27% |
| EBITDA Margin | 11.2% | 15.4% | 14–18% |
| Cost Visibility | Low | High | Moderate–High |
Insight: The company moved from below benchmark to competitive positioning—without operational disruption
What Changed Operationally
This wasn’t just cost-cutting. It introduced financial discipline:
- Monthly expense monitoring system implemented
- Vendor review cycle established
- Centralized cost visibility across departments
- Decision-making shifted from reactive → data-driven
What we did?
We applied a targeted financial optimization process:
1. Expense Audit
- Full transaction-level review (12 months)
- Identification of recurring and redundant spend
2. Cost Normalization
- Categorized expenses into fixed, variable, discretionary
- Benchmarked against industry standards
3. Vendor Optimization
- Renegotiated pricing based on current scale
- Eliminated pricing inefficiencies
4. Financial Infrastructure Optimization
- Reduced banking and processing fees
- Simplified financial stack
5. Control System Implementation
- Ongoing cost governance
- Monthly expense monitoring
In manufacturing, profit leakage rarely comes from a single large issue.
It comes from
small, recurring inefficiencies that compound over time.
Most companies don’t see it—because their systems aren’t designed to.
Measurable Results
Financial Impact
- Payback Period: < 30 days
- Operating Expense Reduction: 6.8%
- Annual Savings: ~$42,000
- EBITDA Increase: +4.2%
- Cash Flow Improvement: Immediate
Before vs After Snapshot
| Metric | Before | After | Change |
|---|---|---|---|
| Revenue | $10.2M | $10.2M | — |
| Operating Expenses | $2.91M | $2.71M | ↓ 6.8% |
| OpEx % | 28.5% | 26.6% | ↓ 1.9 pts |
| EBITDA | $1.14M | $1.56M | ↑ $420K |
| EBITDA Margin | 11.2% | 15.4% | ↑ 4.2 pts |
Find Your Hidden Profit
If your business is growing but cash flow isn’t improving, you likely have the same problem.
We identify and eliminate financial leakage—fast.
- No disruption to operations
- Measurable impact within 30 days
- Immediate ROI